To get a good idea of what can be done with an MD/PhD, our best reference frame is those who have completed their training. The AAMC puts out yearly reports of data gathered from residency applications and makes it available as a comprehensive report (Charting Outcomes) and gathers similar data from medical school applications (FACTS). Less frequently, they do assessments of the workforce and former trainees, and in 2018 the AAMC conducted a study to look at the outcomes of physician-scientists produced by the MSTP & MD/PhD programs from around the country which can be found here. While some of the data will have certainly changed in the past 7 years since this study was conducted, it is still useful to understand the common outcomes and careers of the people who have completed this training. The survey was (unsurprisingly) voluntary and had a completion rate of 44%, and although they note that the response rate was similar between sexes, it is impossible to know if there is bias with respect to the outcomes of those who completed the survey, e.g. academic physicians preferentially responding.
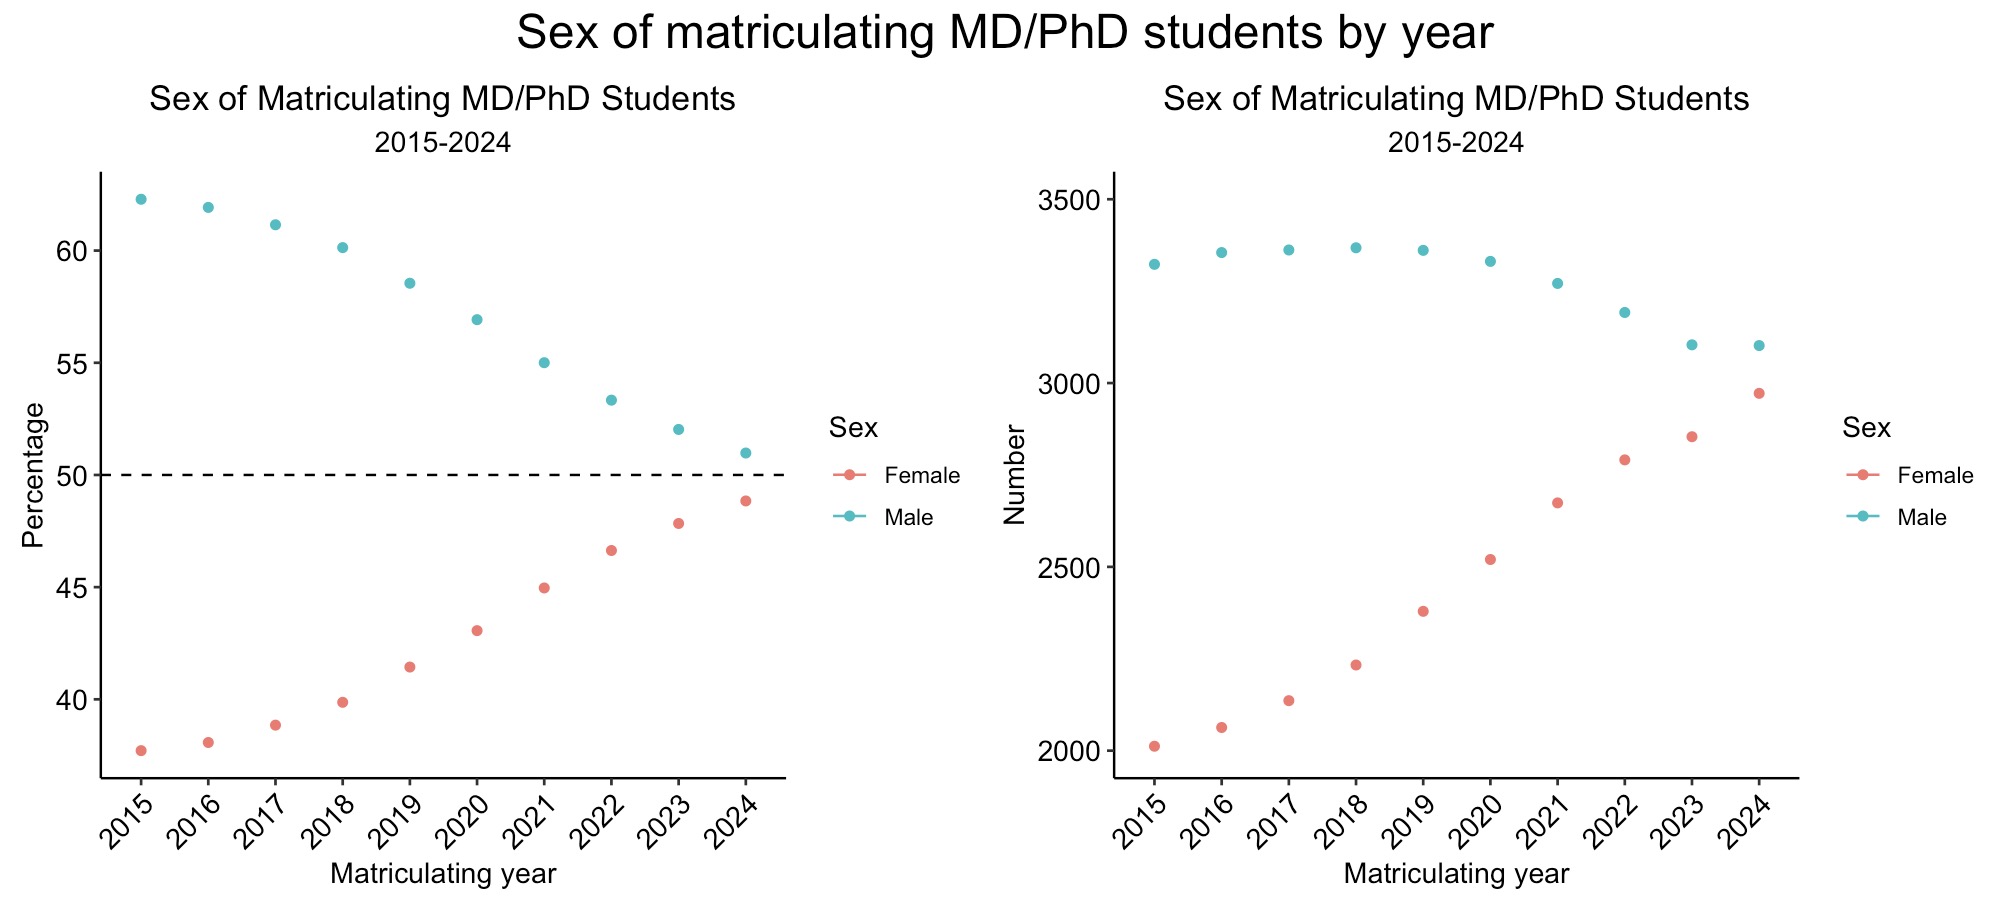
Approaching sex parity
In Figure 4, we can see the gradual progress towards sex parity in MD/PhD graduates since 1974. Starting with almost 100% of graduates identified as male from AAMC application data, we can see the lines representing the percent of men and women slowly converging as time passes. In the key takeaways of the report, the AAMC notes that this process was slower with MD/PhD graduates than MD-only graduates. We can see the continuation of this trend in matriculating students in the subsequent years not included in the study, with gender parity almost achieved in the matriculants in 2024. Up until around 2020, this progression towards parity did not come at the cost of fewer males matriculating, but an increase in the overall matriculants to MD/PhD programs. However, beginning in 2020 the amount of male matriculants begins to decrease, which mirrors broader demographic shifts of fewer men enrolling in higher education. Given the similar shifts in demographic trends amongst both medical student matriculants and graduate student matriculants, and a continued decrease of male enrollment in higher education, it will not be surprising to see women become the majority of MD/PhD matriculants in the years ahead.
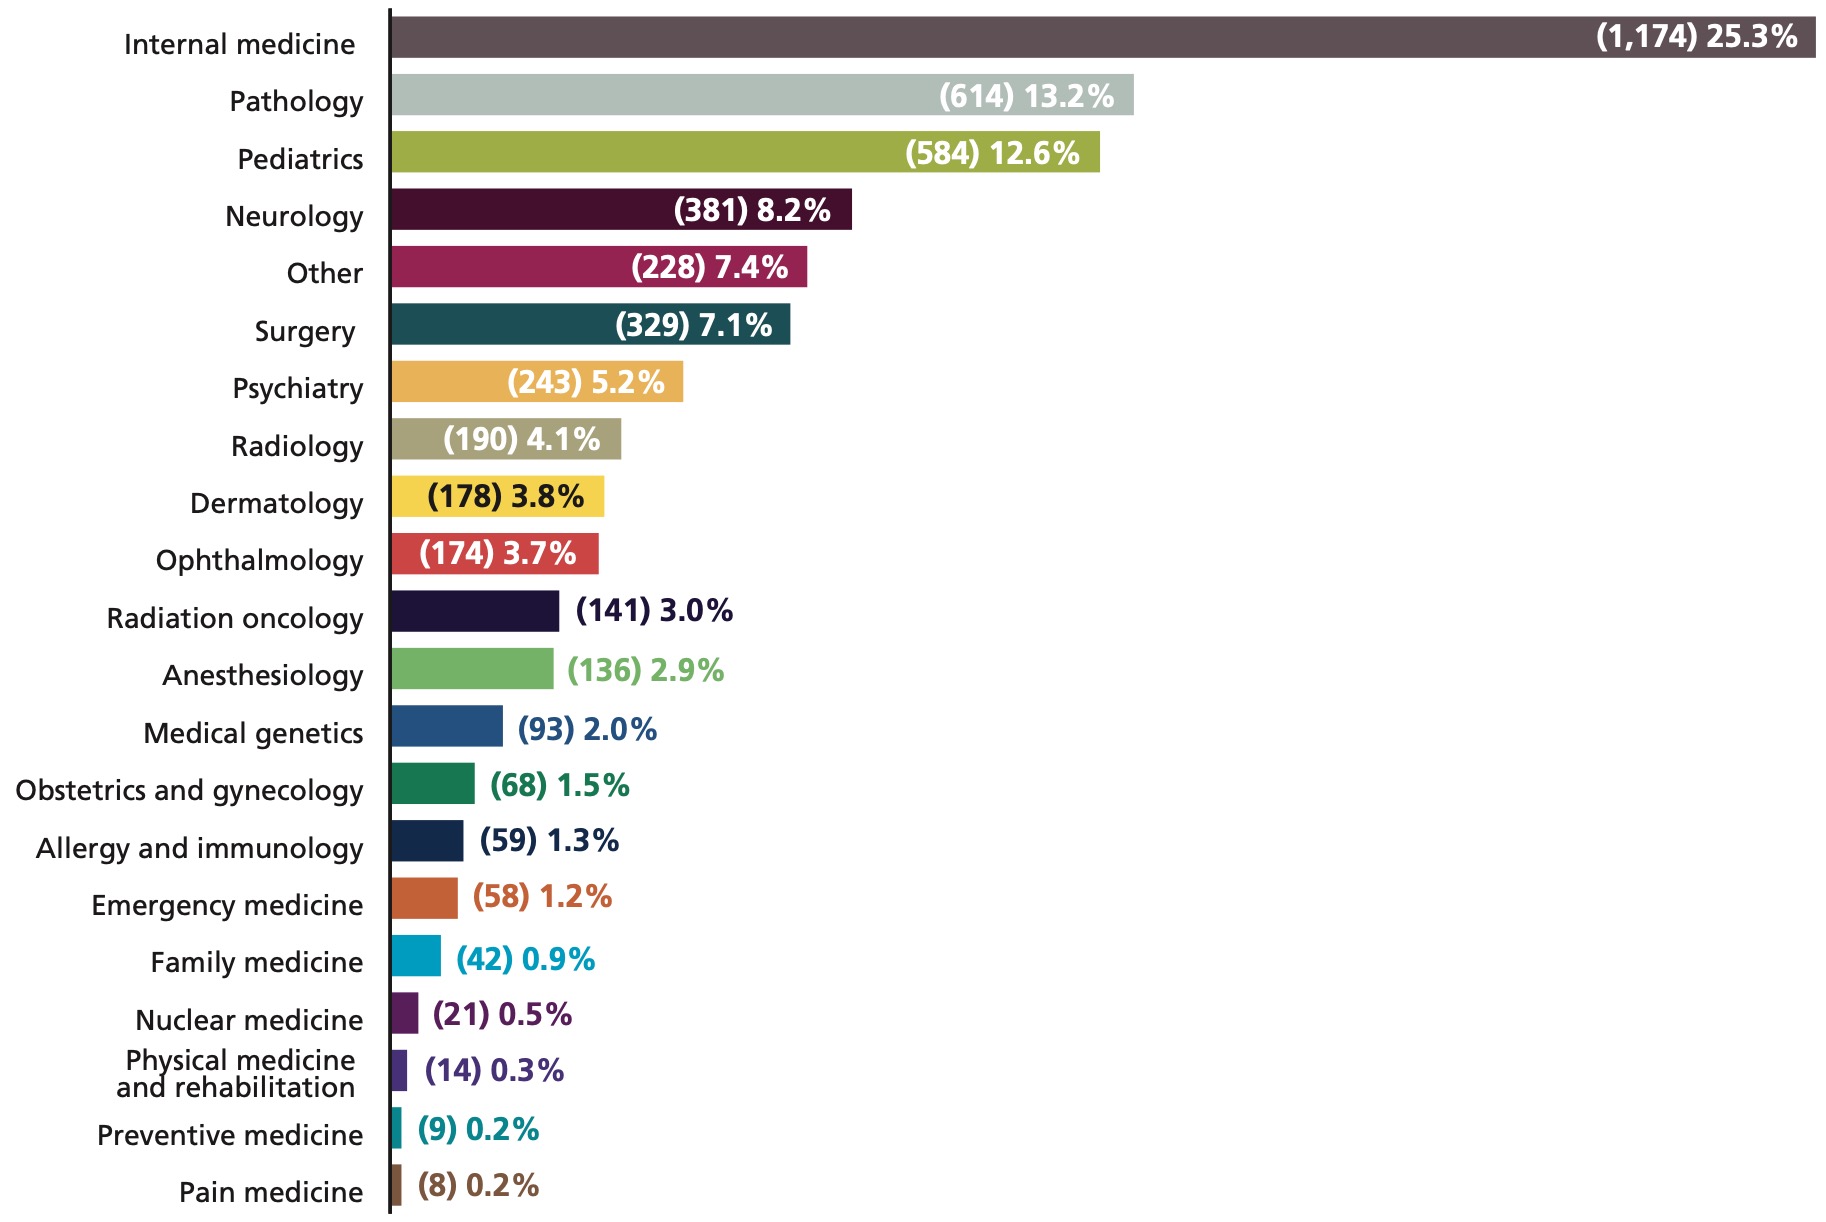
Most respondents who start work in academia stay in academia, and complete residencies in IM, pathology or pediatrics
For the respondents who went on to complete residency training and start working in academia, they tend to stay in academia, with ~85% of respondents following this pathway. However, this first workplace choice varied widely by medical specialty, and those who did not complete subspecialty/fellowship training were less likely to work in academia as their first job. The time to the first position in academia for IM subspecialties generally reflect the length of the respective subspecialty training duration. Historically, MD/PhD graduates have typically done postgraduate residency training in IM, pathology, pediatrics, and neurology. However, this is beginning to change, with equal percentages of graduates in surgery and neurology, and 1/3rd of all graduates completing training in specialties other than IM, pathology, pediatrics, neurology, and surgery.
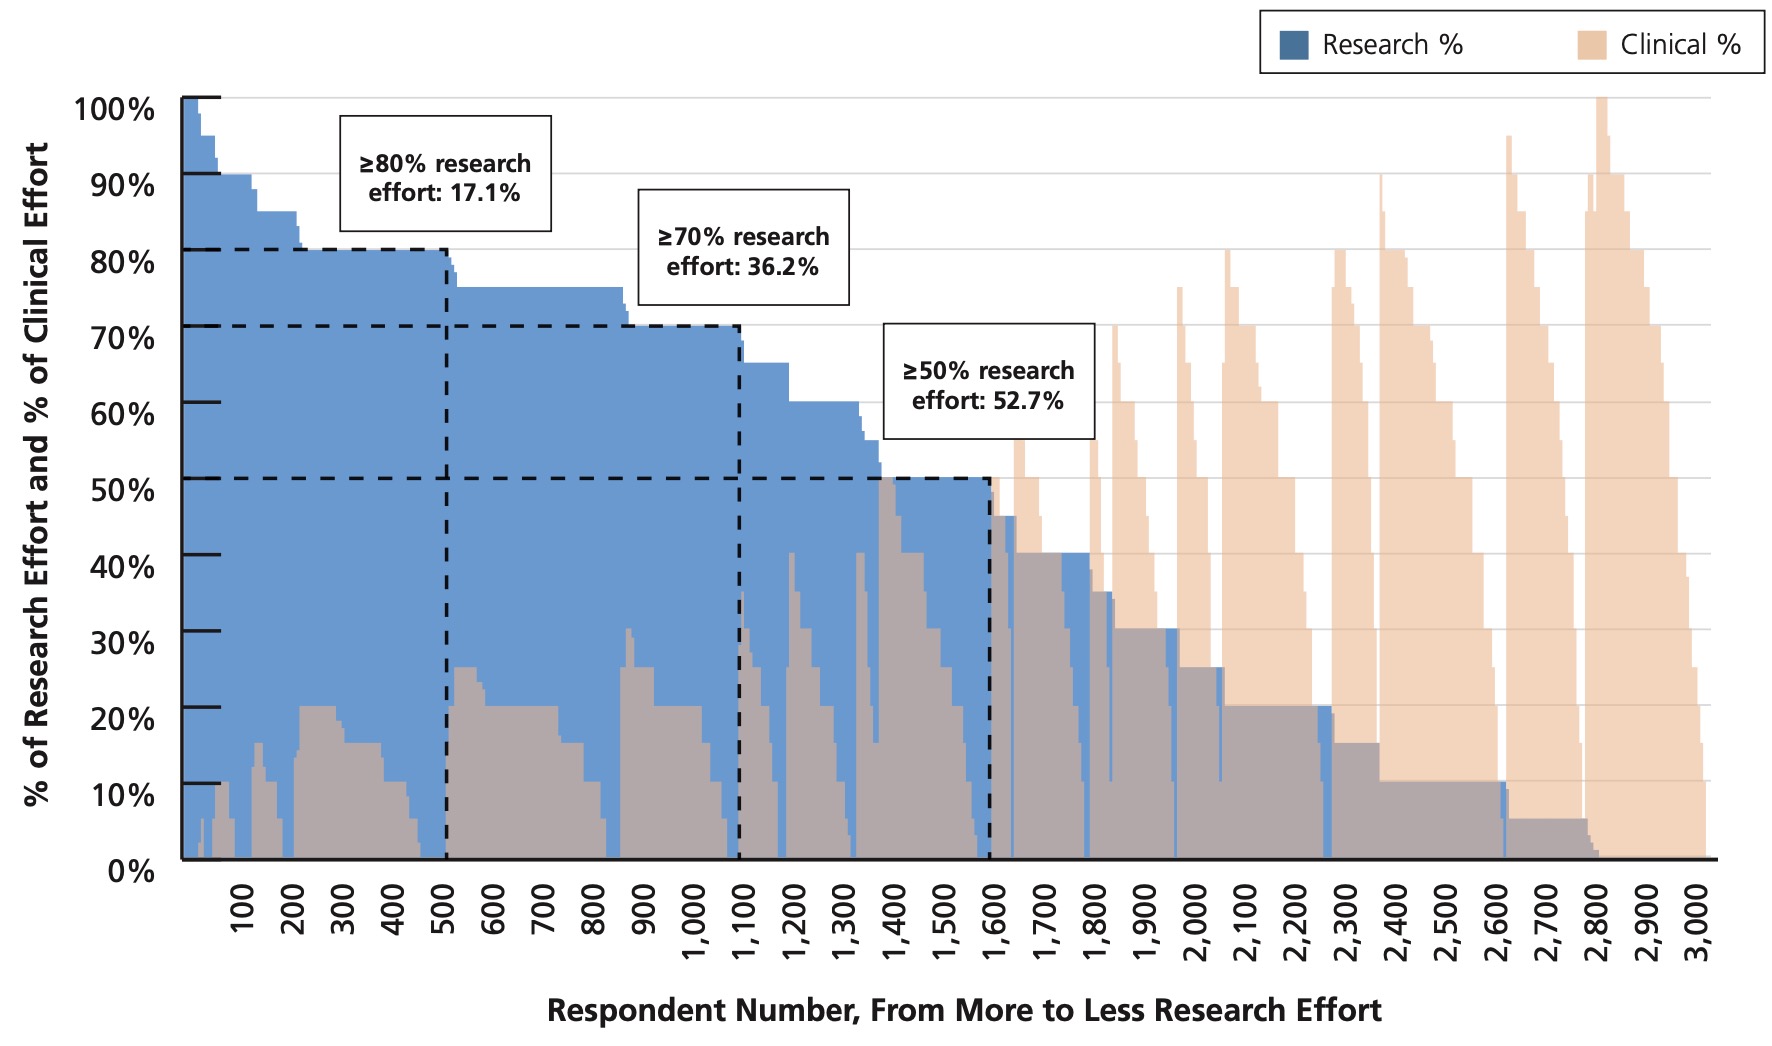
Few respondents have an 80% research, 20% clinical split, but a slim majority have 50% research effort
Of the respondents, only 17.1% have the “classical” 80% research, 20% clinical split. However, that isn’t to say that many graduates do not have a large portion of their time devoted to research, as 36.2% have a 70% research, 30% clinical split, and roughly 50% of the respondents have an equal divide between their research and clinical effort. Unsurprisingly, these percent efforts vary based on current grant funding, with those who are PIs on non-NIH grants and NIH career development awards/NIH research grants devoting ~2/3rds and ~3/4ths of their time to research, respectively. Interestingly, 51% of all respondents who are PIs on research grants only receive funding from non-NIH grants, with many having funding from multiple different sources (such as private foundations, pharma/biotech, or other federal and private sources).
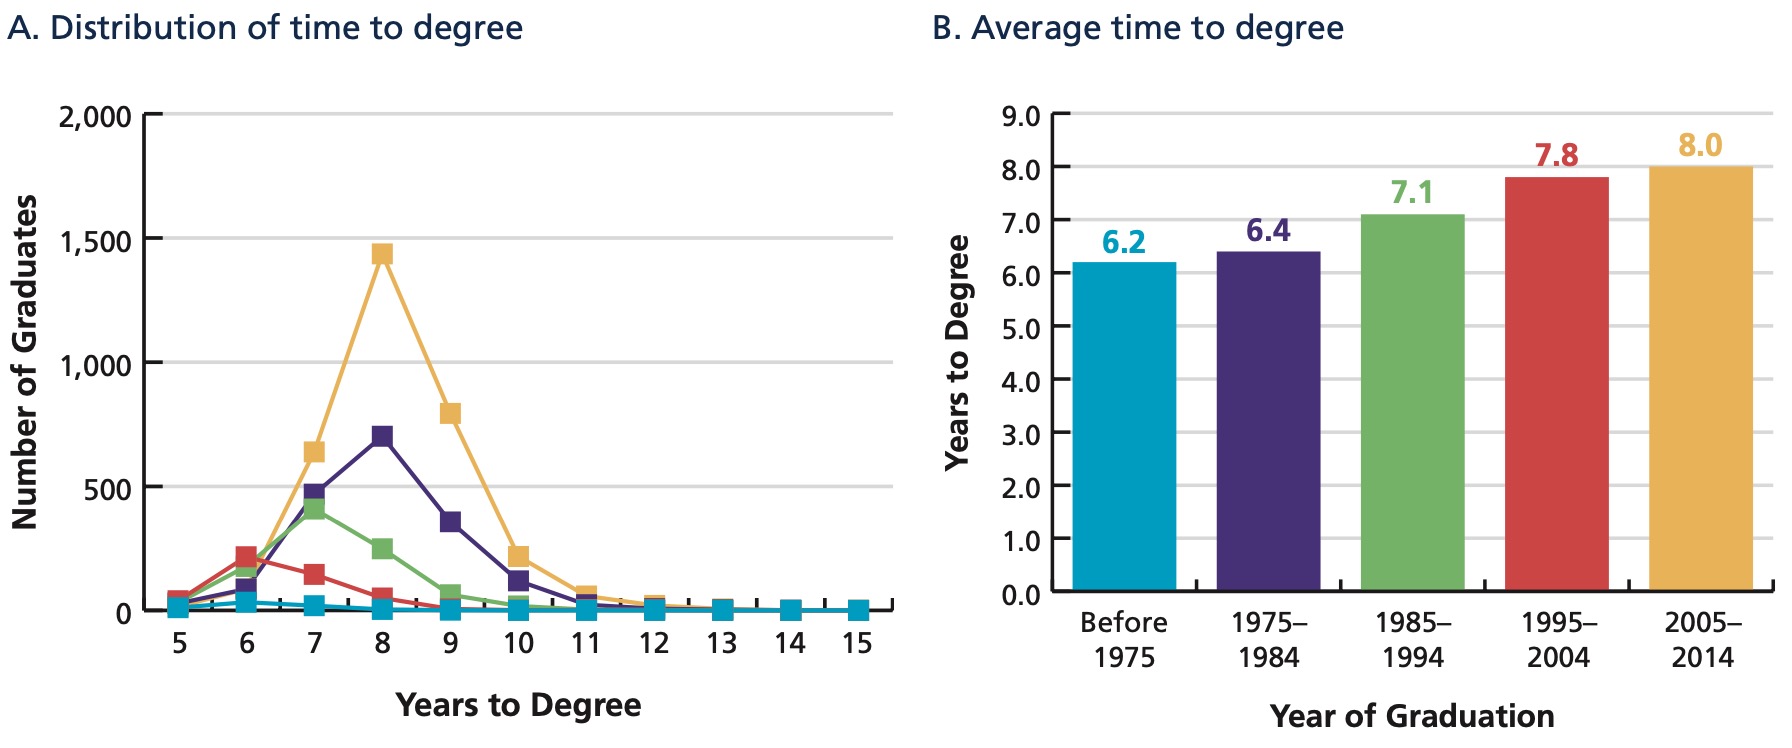
The duration of degrees and time to first faculty positions continues to increase
This is a topic that warrants a post of its own (which will come in due time), but the average time to degree, as well as the shape of the distribution, has shifted greatly since the earlier days of combined MD/PhD programs to the present. The average time to degree has increased from 7 years or less before 1994 to 8 years from 2005-2014. When I was applying for programs, based on the program information on websites it seems like this value is continuing to creep up, and I would not be surprised to see an increase in the value in years to come. Secondarily, the time to faculty positions (be it instructor positions or assistant professors) has also seen a striking increase since the earliest days, although the median and overall distribution is essentially the same from 1985-1994 as 1995-2004. However, this information is not very recent, and it will be interesting to see how this value changes in the years to come (likely increasing given the decreasing amount of available faculty positions as well as available research funding).